
Key Points
- Google adds Data Tables to NotebookLM, enabling chart creation from multi‑source data.
- Feature can export tables directly to Google Sheets.
- Initially available to Pro and Ultra users; broader rollout planned.
- Designed for organizing notes, price‑comparison charts, and aggregating research results.
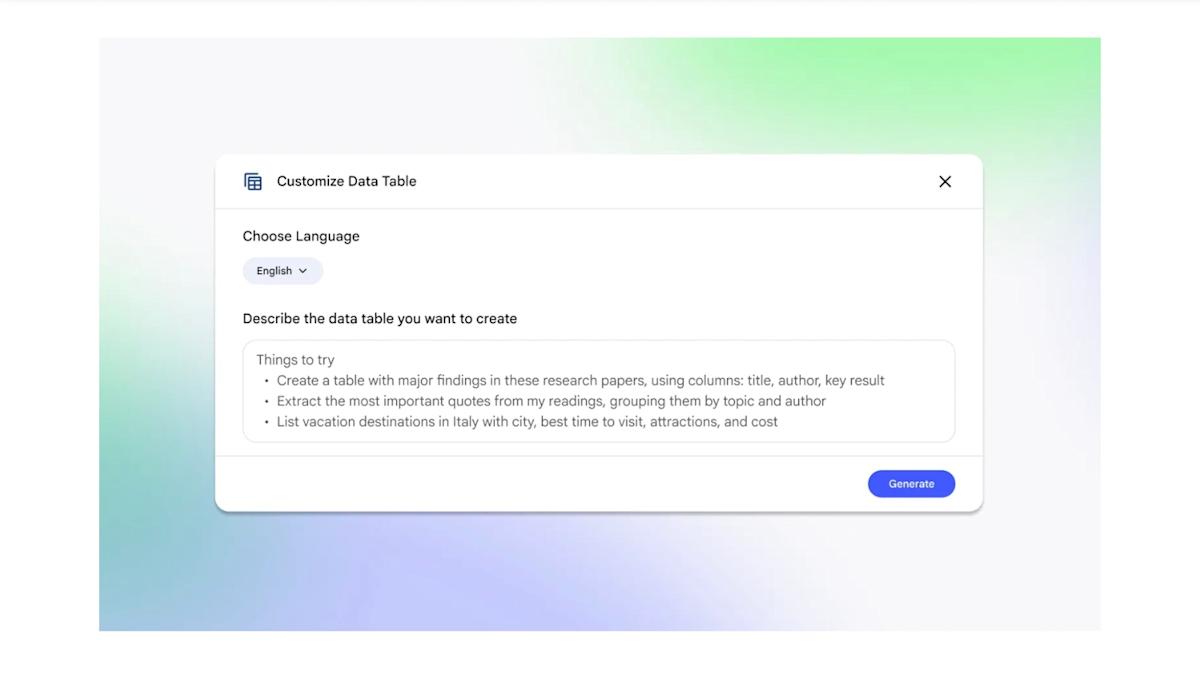
- Uses natural‑language prompts to define table components.
- Follows the recent Deep Research mode launch for handling complex queries.
- Deep Research was first introduced for the Gemini chatbot in late 2024.
Google’s NotebookLM Gains Data Tables Capability
Google announced the introduction of Data Tables, a new capability for its NotebookLM artificial‑intelligence research platform. The feature enables users to gather and synthesize information across multiple sources and automatically generate a chart that can be exported directly to Google Sheets. Initially, Data Tables is accessible to Pro and Ultra users, with a broader rollout to all users planned over the coming weeks.
In practice, Google suggests several use cases for the tool. Users can employ Data Tables to organize scattered notes, build price‑comparison charts, or aggregate results from multiple research projects. The interface allows users to describe the desired table components in natural language, and the system constructs the corresponding table accordingly.
Data Tables follows Google’s recent addition of a Deep Research mode to NotebookLM, which was first unveiled for the Gemini chatbot in late 2024 as a solution for handling complex user queries. Together, these enhancements aim to deepen NotebookLM’s utility for researchers, analysts, and other professionals who rely on AI‑assisted data gathering and presentation.
Source: engadget.com